Carbon credits worldwide are managed using clunky spreadsheets
From the world's top companies' sustainability teams to the supply teams within the green tech world, piles of inter-linked spreadsheets with intricate formulas are the golden standard to handle carbon procurement. This approach is prone to human error, in a context where double-counting carbon credits can lead to concerning outcomes.
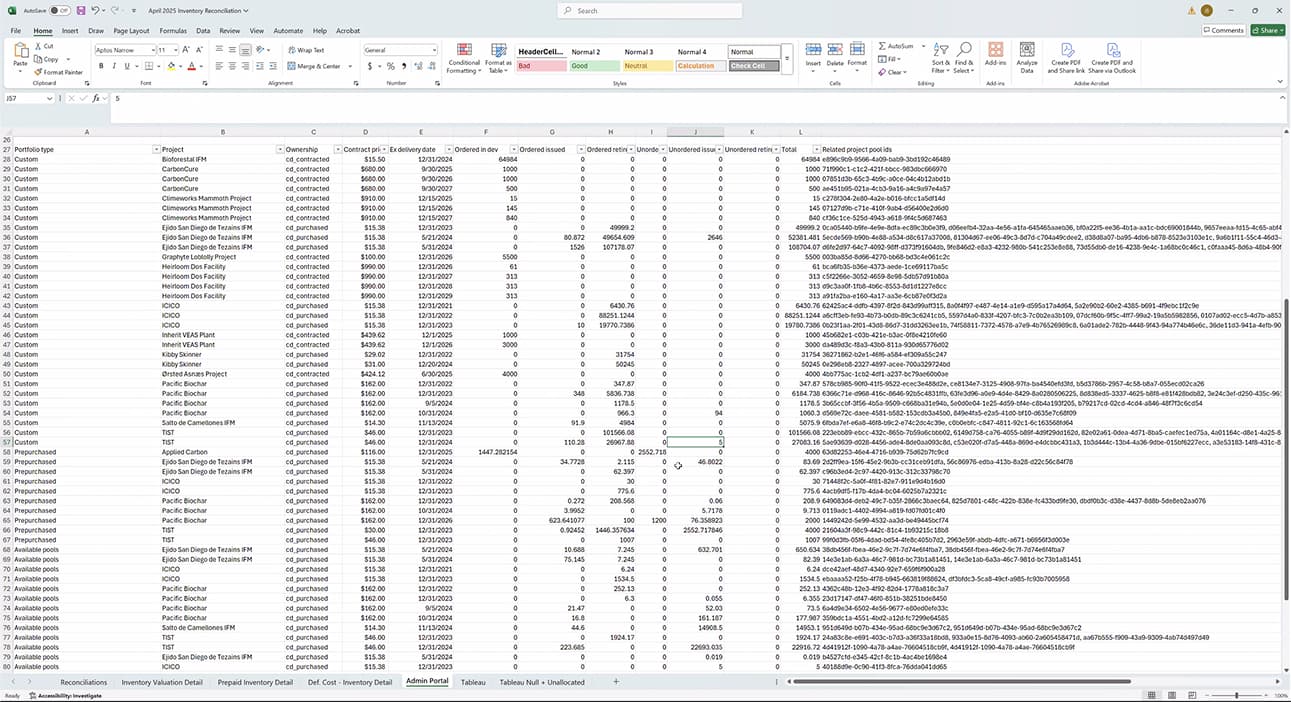
There clearly was a gap in the market that no one else had filled yet. There had been some efforts to make similar software, but they simply did not get the job done. Furthermore, the market had grown and changed in the last couple of years.
Crafting mental models before crafting software
The main challenge in designing such new kind of software from scratch is that you don't have a clear idea about how your end users are effectively going to use it, what are their expectations, what are the mental models they rely on when doing their job.
This translates into even more questions when designing software, for example what level of granularity do we want the users to have to deal with?

This is why we included main stakeholders, our Supply and Offtake teams, early in the process: they attended in-person meetings, sit at the table, and provide us with precious insights in the diverging phase of the design process.
The more I was working with the initial “ingredients” of this product, the more it became clear that we were fitting a system of entities into a user interface that needed to handle complex relations across different phases.
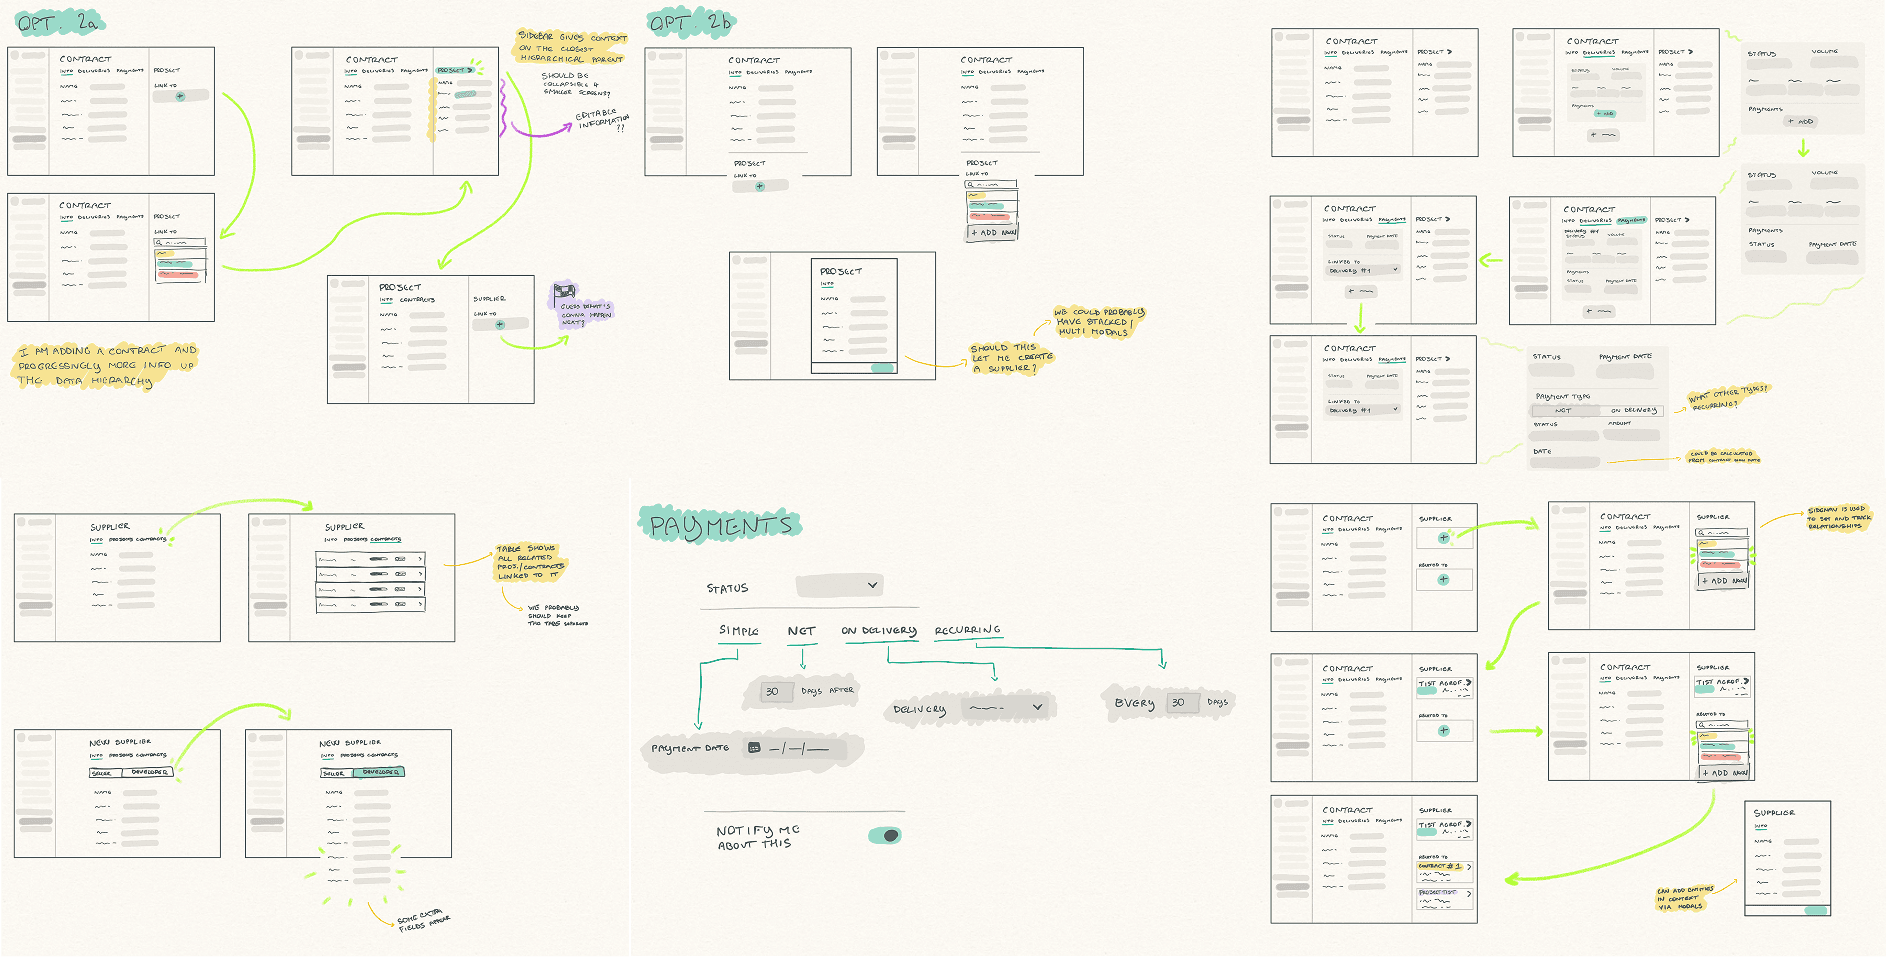
I had frequent chats with our Supply team to understand what the process around carbon procurement was, and started collecting any kind of useful information, from notes to screenshots of spreadsheets, to slides, and went back to the team with a few proposals made in Airtable so everyone could play with them.
Fail fast and move on
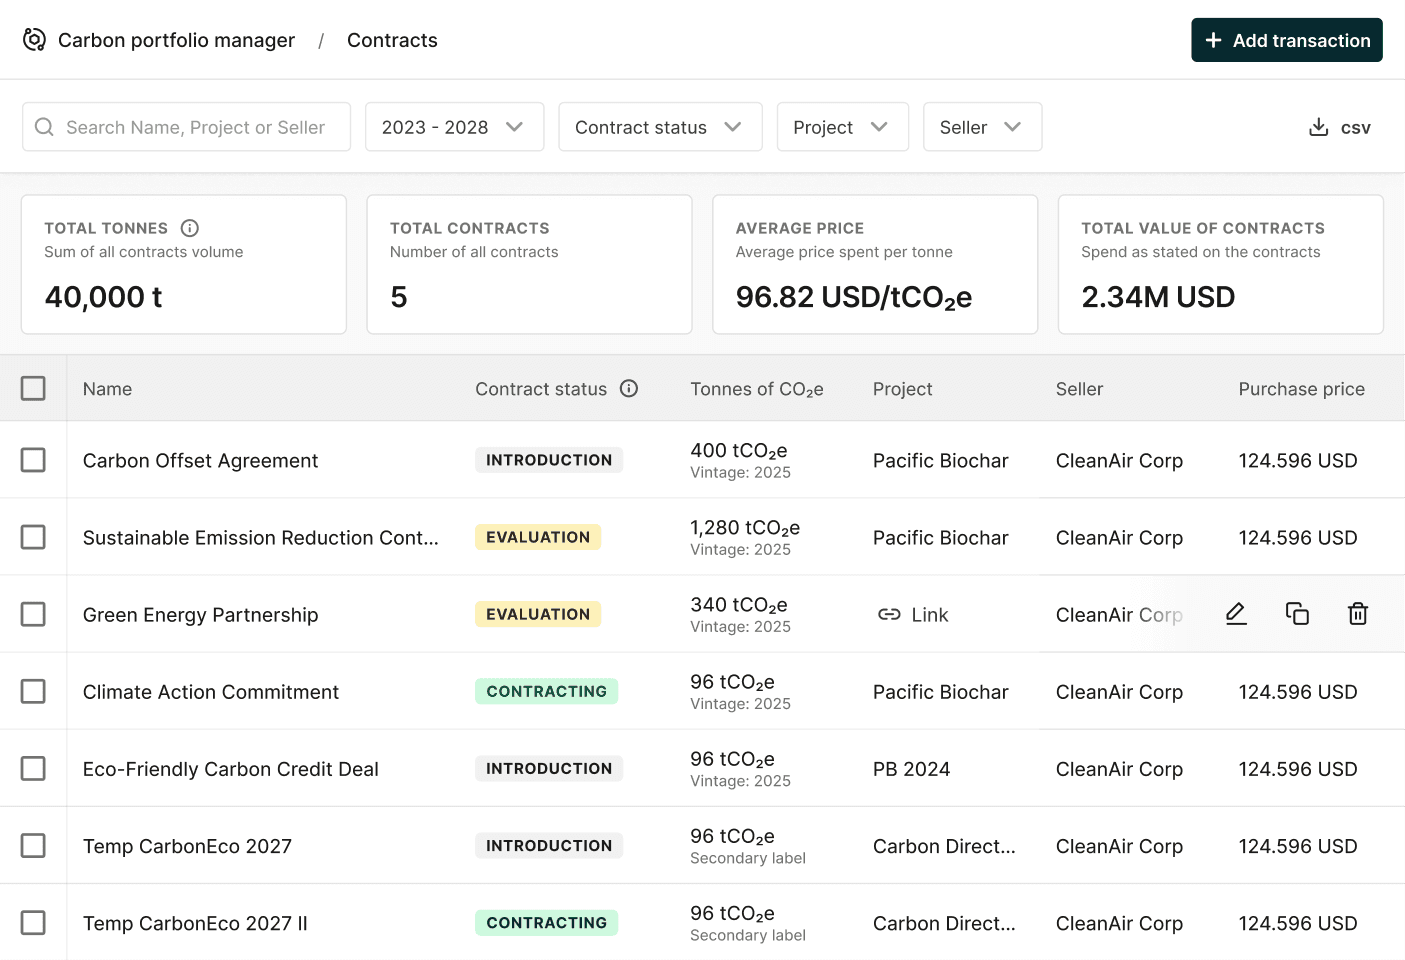
The first solution the team the developed featured the concept of “Transaction” or “Deal”, but that didn’t feel quite right because every piece of information was crammed into the same bucket: the contract name, the party who sold and delivered the credits, the amount of money spent, etc.
This solution turned out unpractical, since our end users would have to manually type the same information over and over again, for example when adding two or more contracts of the same project.
Connecting the dots actors
The third iteration tried to simplify things even more, and it did so successfully. In an attempt at being more clear and literal and after several brainstorming sessions with the Product Manager, we finally settled on a system made of three elements:

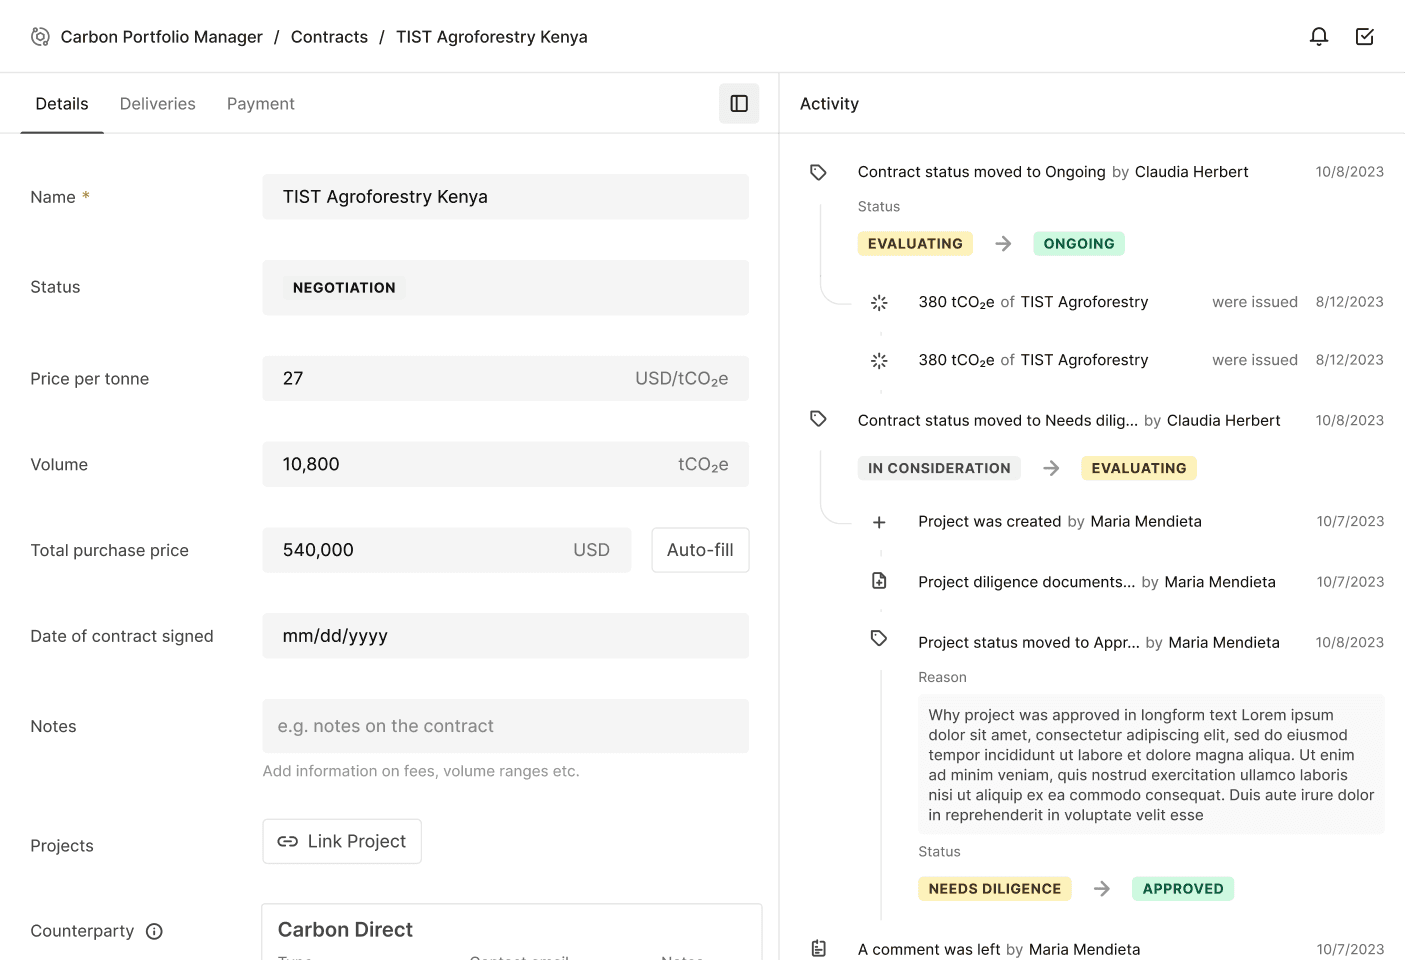
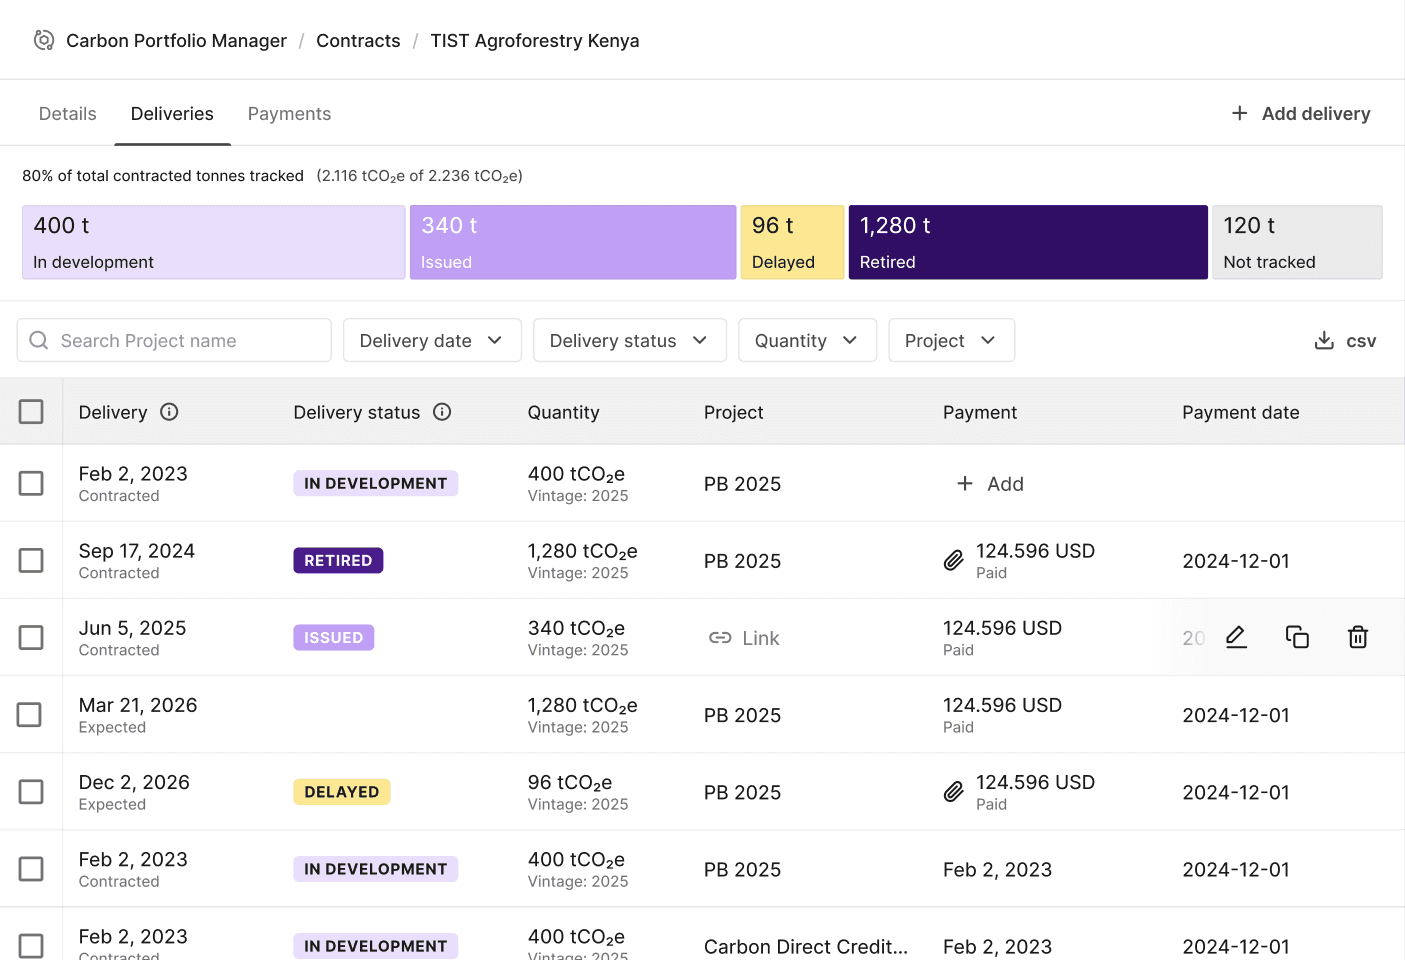
They include all the information relative to the contract itself such as sign status, date signed, and also includes information on carbon credit deliveries, and monetary transaction.

Projects hold information on the type of credit, the removal methodologies used, and its taxonomy: is it a reforestation project, or a highly engineered facility that extracts carbon dioxide from molecules of oxigen? Both are valid!

Suppliers are the parties that the end users are in contact with, and hold contact information such as spokesperson email and company website like a regular CRM. This is very useful for tracking interest in and relationships with suppliers and project developers.
The three entities can be inter-linked, making it easy for companies to re-use existing information.
On a contract, counterparties and projects are linked records—not retyped fields. Contact details, solution type, and diligence status come along automatically. That same graph also lets Carbon Direct see which credits or projects have been bought the most, and which suppliers are most trustworthy based on delays in credit issuances.
Tightening the feedback loop
One small practice let us ship faster. I worked in-tandem with the rest of the team by leveraging our time zone difference: I made sketches during my morning and recorded a ~2m Loom explaining them the reasons behind the progress that was made.
This has enabled us to tighten the feedback loop and squeeze in more tasks into each two-week sprint.
Impact
The results
People in and out of the company were enthusiastic!
This made for an effective ground for growth for Carbon Portfolio Manager: in only three months, a team of 6 had built a new kind of product that was welcomed enthusiastically by our advisory team, as well as a set of pilot customers that, to date, are still using the product and are paying for it.



"A tool like this will massively help" - Sunny,
- 2
As a side effect, Carbon Portfolio Manager has also increased the in-platform activity, more than doubling the amount of per-user monthly sessions.